A grid of blue icons related to risk management, such as graphs, handshake, lightbulb, and gears, is displayed with the central text "RISK MANAGEMENT" in bold white letters against a dark blue background. The icons represent various aspects and strategies in risk assessments and sustainability.

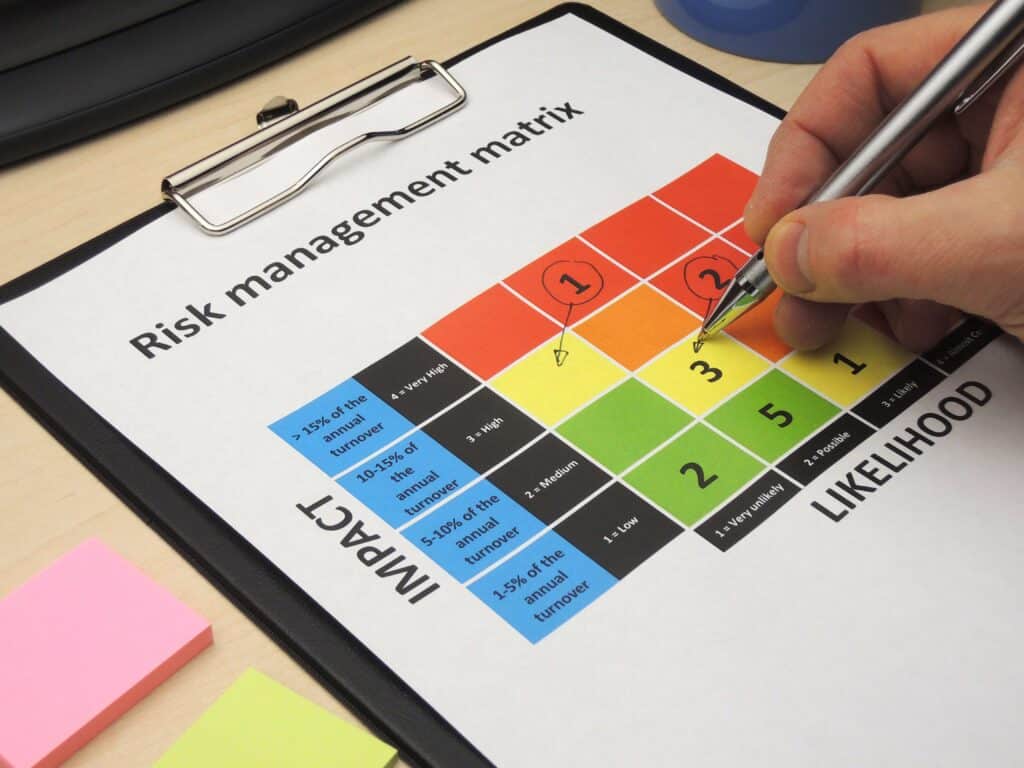
How to Manage Sustainability with Risk Assessments

A yellow robotic arm with a precision tool at the end is assembling or inspecting metal parts arranged neatly on a table in an industrial setting. The background includes machinery components, indicating a production or manufacturing environment.

What is ESG for a Manufacturing Company?

A person is using a pen to mark a spot on a risk management matrix chart. The chart, clipped to a clipboard, categorizes risks by impact and likelihood with color coding from green to red. Sticky notes are placed near the bottom left corner of the clipboard.

ESG and Corporate Risk

A green and yellow graphic for a podcast. The left side features the text "ESG PRO" in white on a green background. The right side has a yellow oval with "PODCAST" in black text. Below, a subtitle reads "Podcast #1 The Value of ESG Reporting and Why It Matters.

ESG Reporting and how it adds value

A 3D word puzzle with green and white cubes spells out interconnected words: "RESPONSIBILITY," "PEOPLE," "PROFIT," "SOCIAL," and "PLANET." The words are arranged in a crossword-style layout, emphasizing social responsibility within ESG and balance among people, profit, and the planet.

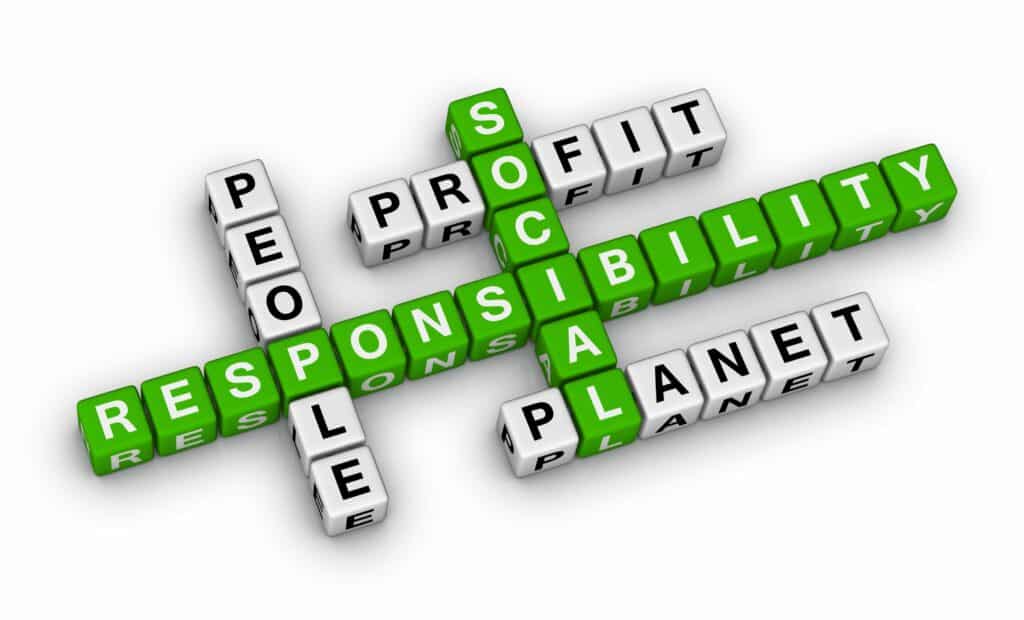
What is Social within ESG?

A landscape with industrial chimneys emitting thick smoke into the sky. In the foreground, a road sign with a red triangle and a green symbol inside it stands next to a label that reads "GREENWASHING," highlighting the commercial risk of deceptive environmental claims.

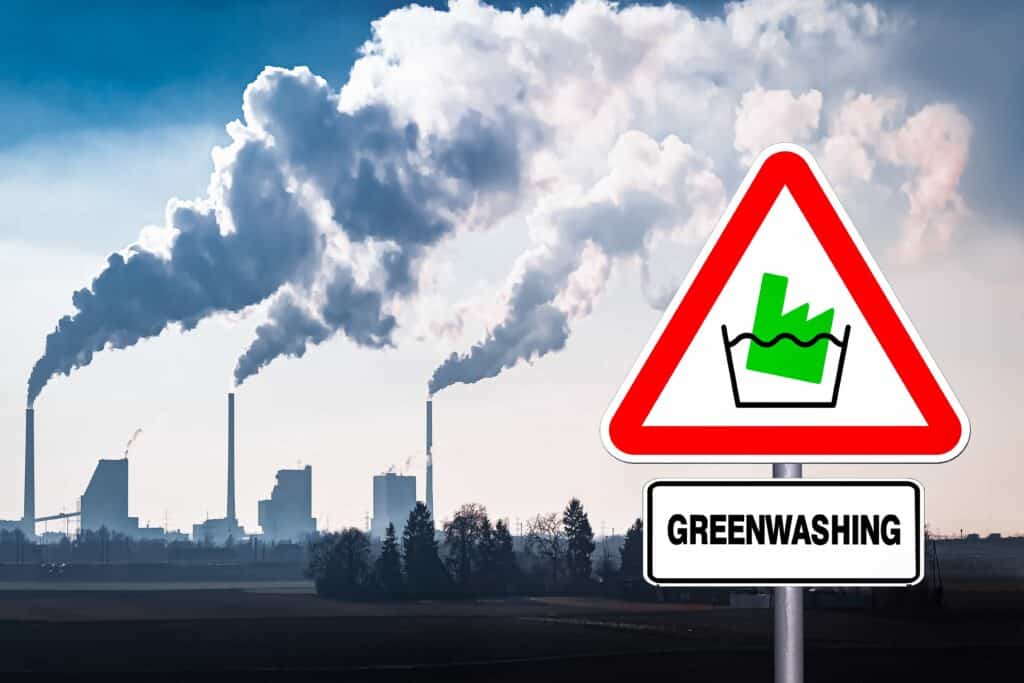
Why Greenwashing is a Commercial Risk

A detailed infographic titled "Scopes of Emissions" vividly illustrates carbon emissions. Three arrows, labeled Scope 1, Scope 2, and Scope 3, point to various emissions (CO2, SF6, CH4, N2O, HFCs, PFCs, NF3). Scope 1 covers direct emissions; Scope 2 covers indirect energy emissions; and Scope 3

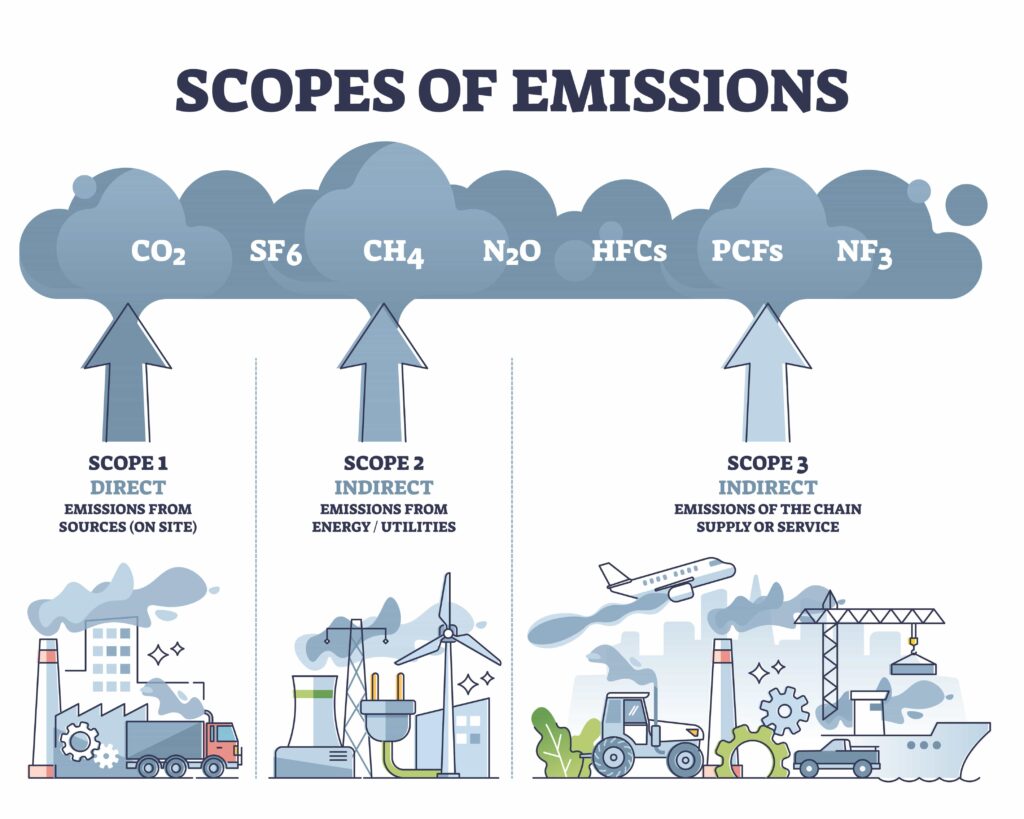
What are Carbon Reporting Scopes?

A colorful illustration emphasizing the concept of "Assessment" with related terms, such as Goal, Measure, Analysis, Plan, Evaluation, Audit, and Result. Visual elements feature a bullseye, ruler, magnifying glass, clipboard, and upward graph—integrating aspects of Materiality Assessment for sustainability and ESG considerations.

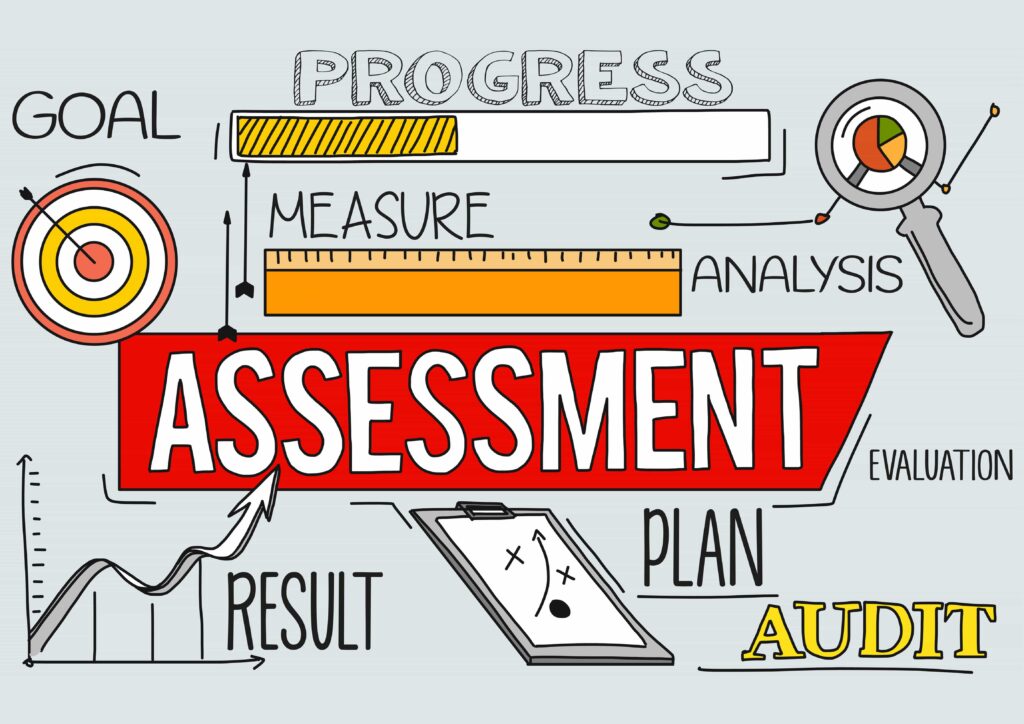
Starting an ESG Materiality Assessment

An image featuring a jigsaw puzzle with three bright blue pieces interlocked together in the center. The word "GOVERNANCE" is prominently displayed in white text on the puzzle pieces. The background consists of numerous indistinct white puzzle pieces, subtly hinting at ESG principles.

What is Governance within ESG?

A panoramic view of lush, green, forested mountains under a partly cloudy blue sky. The dense canopy of trees covers the rolling hills and valleys, extending towards the horizon and creating a tranquil, untouched natural landscape that embodies the principles of Carbon Neutral Certification.

Carbon Neutral Certification

Previous 1 … 24 25 26 27 28 29 Next
ESG PRO Limited
Based on 27 reviews